User Features
The features described in this section are accessible to any authenticated user of the application. Users can browse and manage issues within their assigned projects, log time spent on tasks, and personalize their dashboard through the My Page view.
Moving Between Projects
The project switcher in the application header scopes the views to a single project. It lists the projects the user may see, and opens with a Recently used group at the top holding the projects the user visited most recently, so that returning to current work does not require searching the full list. Projects can also be pinned to that group with the Add bookmark action on the project overview.
Selecting All projects removes the project scope, and the issue and time entry lists then span every project the user can see.
Issues
The Issues view displays all issues within a project. Users can create new issues, edit existing ones, and perform actions such as logging time or copying issue links. Issues are the core entity of the Issue Tracker and represent tasks, bugs, support requests, or any other trackable item.
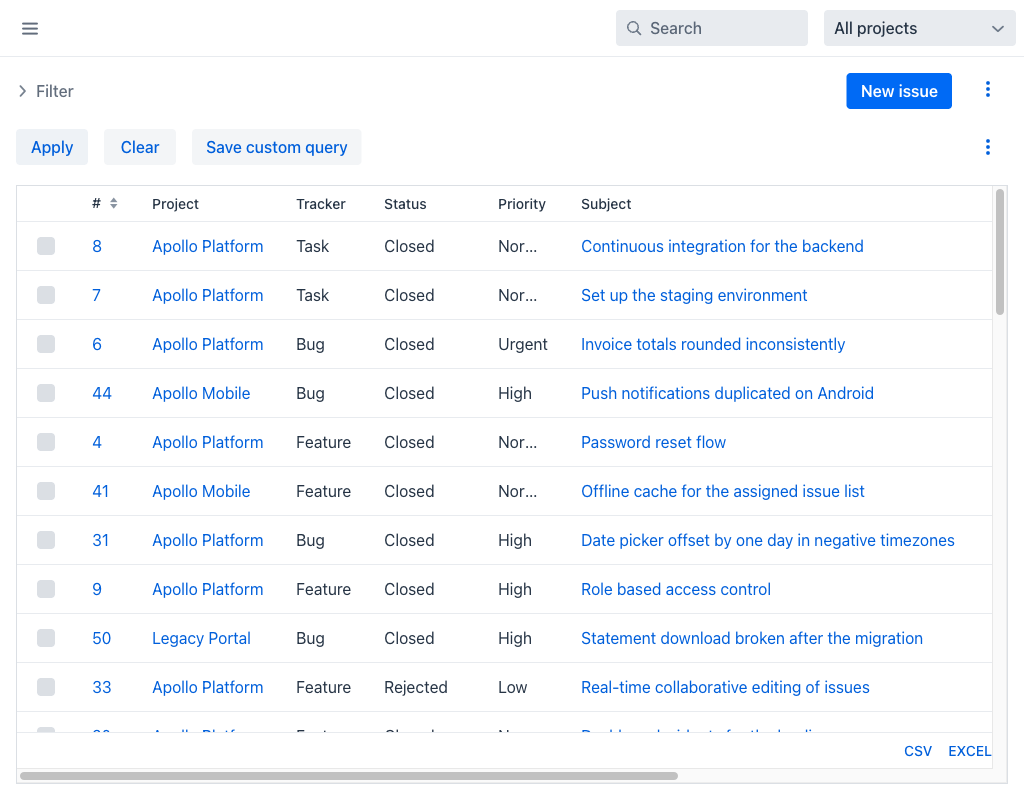
Issues Grid
The grid displays the following columns by default:
- #: The unique numeric identifier of the issue, linking to its detail view.
- Tracker: The type of the issue.
- Status: The current workflow status of the issue (e.g., New, In progress, In review, Closed).
- Priority: The priority assigned to the issue.
- Subject: The issue title, linking to its detail view.
- Assignee and Author: The users the issue is assigned to and who reported it.
- Actions: A per-row actions menu (⋮) with available operations.
When the list is not scoped to a single project, a Project column is shown as well. The default selection is configurable in the Issue tracking tab of the Settings view, and further columns — Category, Target version, Start date, Due date, Estimated time, Spent time, % Done, Created, Closed and any custom field — can be added there.
The Spent time and Total spent time columns link through to the Spent time view filtered to the issue in question.
Filters
Filters are contained in a collapsible Filter panel above the grid, which keeps the list itself in view. Expand it to reveal the active filters:
- Status: Filters issues by their current workflow status. By default, only issues with the Open status group are shown.
Additional filters can be added using the Add filter dropdown, which includes: Tracker, Author, Assignee, Priority, Target version, Subject, Description, Category, Estimated time, Done percentage, Start date, Due date, and any custom field marked as usable for filtering.
The Apply, Clear and Save custom query buttons sit in the row directly above the grid, alongside the column totals, and remain reachable whether or not the filter panel is expanded. Save custom query stores the current filter configuration — and the current column selection — for reuse.
A Group by selector arranges the results into collapsible groups. Grouped results are capped at the first 500 issues; when the cap is reached the view says so, and narrowing the filters restores a complete grouping.
Row Actions
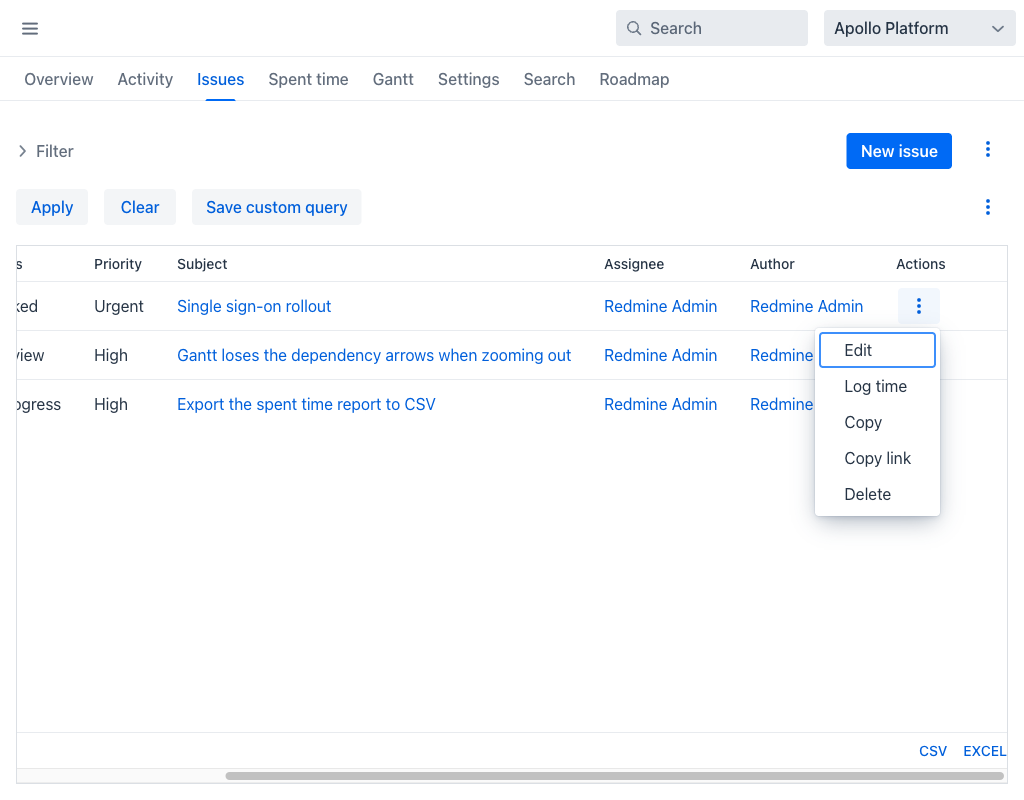
Click the ⋮ icon on any row to access the following actions:
- Edit: Opens the issue detail view where the issue fields can be modified.
- Log time: Opens a dialog to record time spent on this issue.
- Copy: Opens a New issue form preloaded with the values of the selected issue, so that the copy can be adjusted before it is created. The new issue records a copied from relation back to the one it was copied from, which is shown in the Related issues section of both. Copying is offered only to users whose role allows them to add issues of that tracker in that project.
- Copy link: Copies the direct URL of the issue to the clipboard.
- Delete: Permanently removes the issue after a confirmation step.
Warning
Deleting an issue is a permanent action and cannot be undone. All associated time entries and history will also be removed.
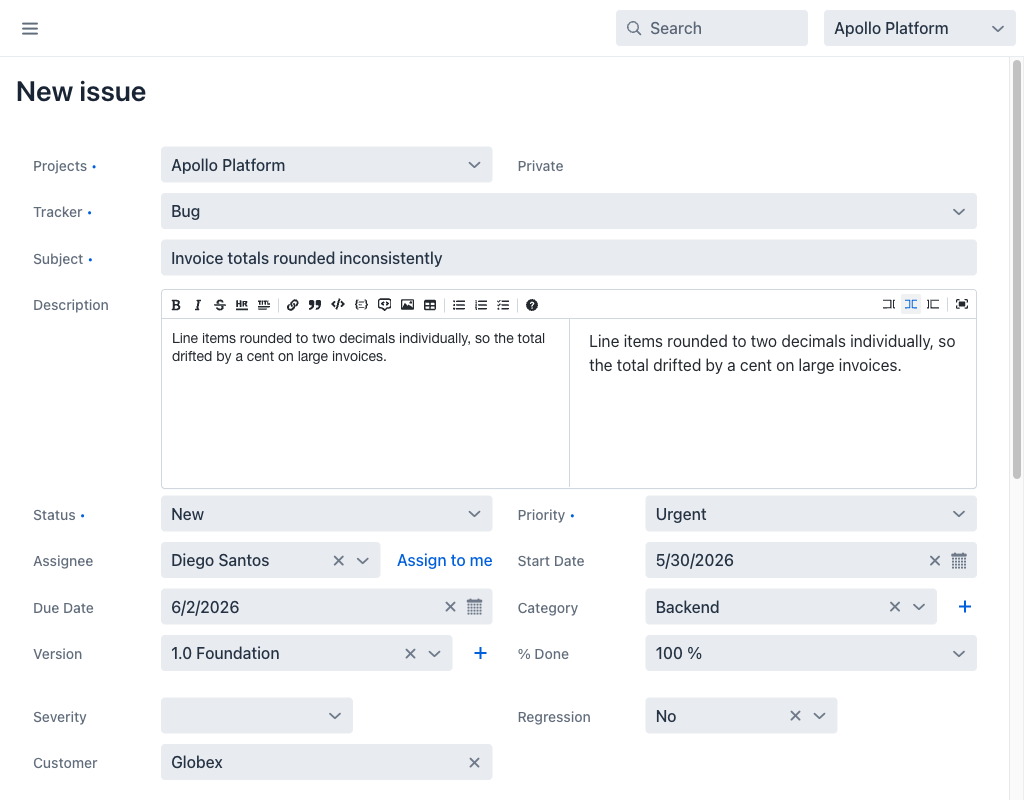
Creating an Issue
Click the New issue button at the top of the issues list to create a new issue. The creation form includes fields such as Tracker, Subject, Description, Status, Priority, Assignee, Target version, Start date, Due date, Estimated time, and Done percentage. The available fields depend on the tracker type, the workflow field permissions for the user's role, and the custom field configuration.
The statuses offered when creating an issue are those the workflow allows for the selected tracker and the user's role. When no workflow is configured, the issue takes the tracker's default status.
Bulk Editing and Importing
Two further actions are available from the ⋮ menu beside the New issue button:
- Bulk edit: Select several issues with the row checkboxes and apply the same change — status, assignee, priority, target version or a custom field — to all of them at once.
- Import: Load issues from a file, mapping its columns onto issue fields. Rows that cannot be imported are reported individually with the reason, so the source file can be corrected and the import repeated.
Exporting
The CSV and EXCEL buttons below the grid export the issues currently listed, using the columns currently selected.
Roadmap
The Roadmap view provides a version-based overview of a project's planned work. It is accessible from the Roadmap tab in the project navigation. Each version is displayed as a section showing its associated issues, progress, and due date, giving all team members a clear view of what is planned for each release.
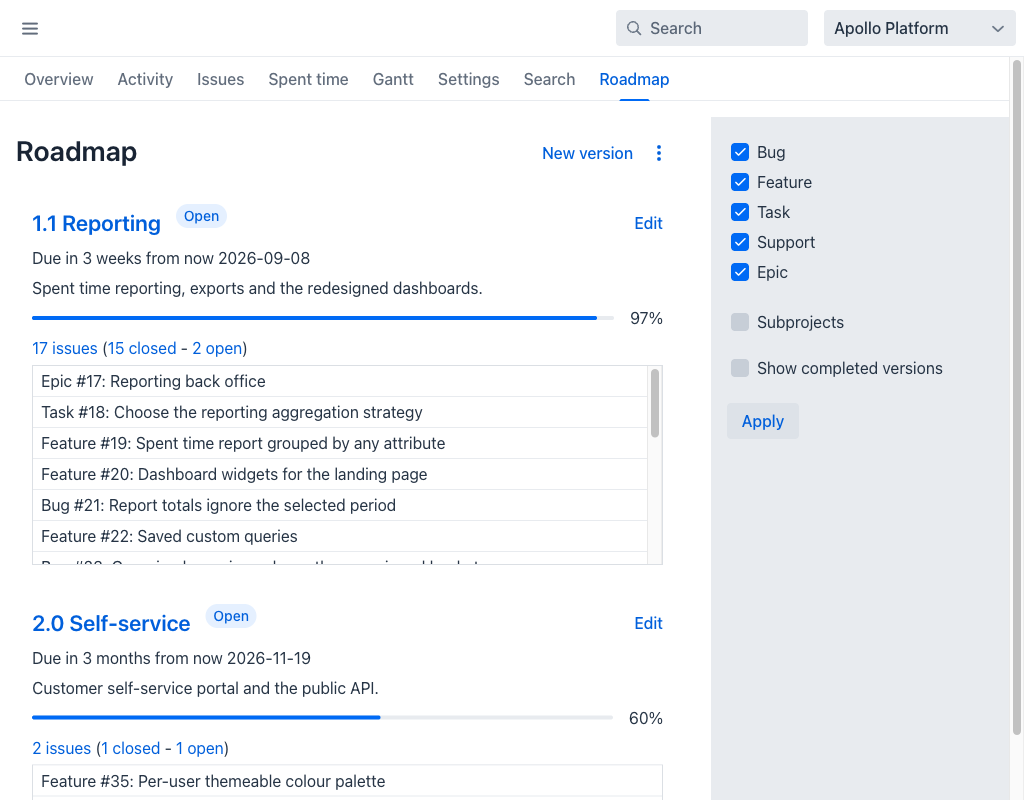
Versions
Each version section includes:
- Version title: A link to the version detail page. For versions belonging to a subproject, the subproject name is prepended to the version name.
- Status badge: The current status of the version (e.g., Open, Locked, Closed).
- Due date: The target completion date of the version. If the due date is in the future, it is shown as a relative description alongside the exact date (e.g., "due in 3 months 2026-08-01"). If the date has already passed, only the exact date is shown.
- Description: The version description, if one has been provided.
- Progress bar: A visual indicator of completion, weighted by estimated hours so that larger issues count for more. A closed issue contributes its full weight; an open issue contributes its % Done. Issues with no estimate are credited with the average estimate of the version's issues, and when nothing has been estimated the figure reduces to the plain average of the done percentages.
- Issue count: A summary line showing the total number of issues, how many are closed, and how many remain open.
- Issues grid: A compact list of issues assigned to the version. Each row shows the tracker name, issue number, and subject. For issues belonging to a subproject, the project name is also shown.
Versions are listed in order of their due date, with versions that have no due date placed last.
Filters
The filter panel on the right side of the view refines which issues are shown within each version:
- Tracker: A checkbox group listing all trackers enabled for the project. Only issues belonging to the selected trackers are displayed. All trackers are selected by default.
- Subprojects: When enabled, versions and issues from child projects are included in the roadmap. This option is visible only when the project has subprojects.
- Show completed versions: When enabled, versions with a Closed status are also displayed. Closed versions are hidden by default.
Click Apply to apply the current filter selection.
Actions
Users with the Manage versions permission see additional controls in the header:
- New version: Opens the version creation form.
- Settings (accessible from the ⋮ menu): Navigates to the Versions tab of the project settings.
Each version section also shows an Edit button for users with the Manage versions permission, which opens the editing form for that version.
Gantt
The Gantt view plots the project's issues along a timeline, drawn from their start and due dates, and connects issues linked by a precedes/follows relation so that dependencies are visible as arrows.
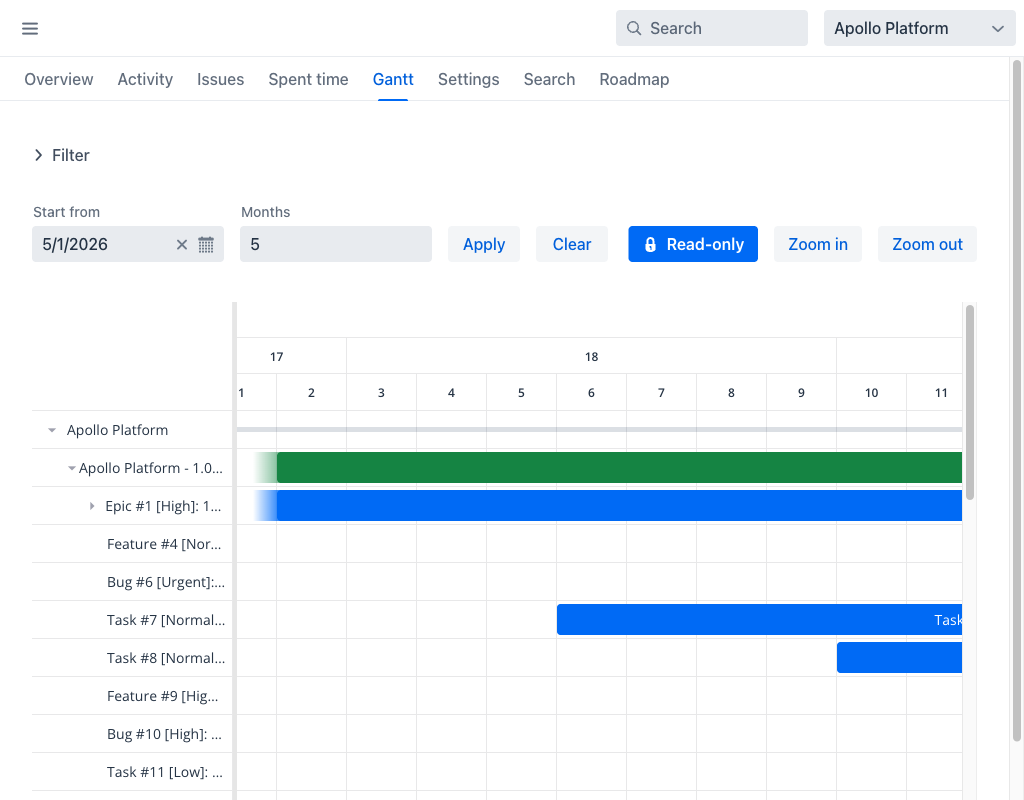
The controls above the chart set the window and the zoom:
- Start from: The first month shown.
- Months: How many months the timeline spans.
- Apply: Redraws the chart with the chosen window.
- Zoom in and Zoom out: Change the density of the timeline.
Issues can be opened from the chart, and users whose role grants the relevant permission can also reschedule them from here. Users without that permission see the chart in Read-only mode; attempting a change reports that the necessary permissions are missing. Filters are available in the same collapsible Filter panel used by the issues list.
Attachments
Files attached to an issue are listed on the issue detail view and can be opened directly. Text-based files are rendered inline in a preview view rather than being downloaded, which makes logs and configuration snippets readable without leaving the application. A Download link is always available.
The preview falls back to a message when it cannot render the file:
- No preview is available for this file — the format is not text-based.
- This file is too large to be previewed — the file exceeds the preview size limit.
- The file content could not be read — the stored file is missing or unreadable.
In the issues grid, the download control for an attachment whose file is no longer present on disk is disabled rather than producing a broken download.
Issues Report
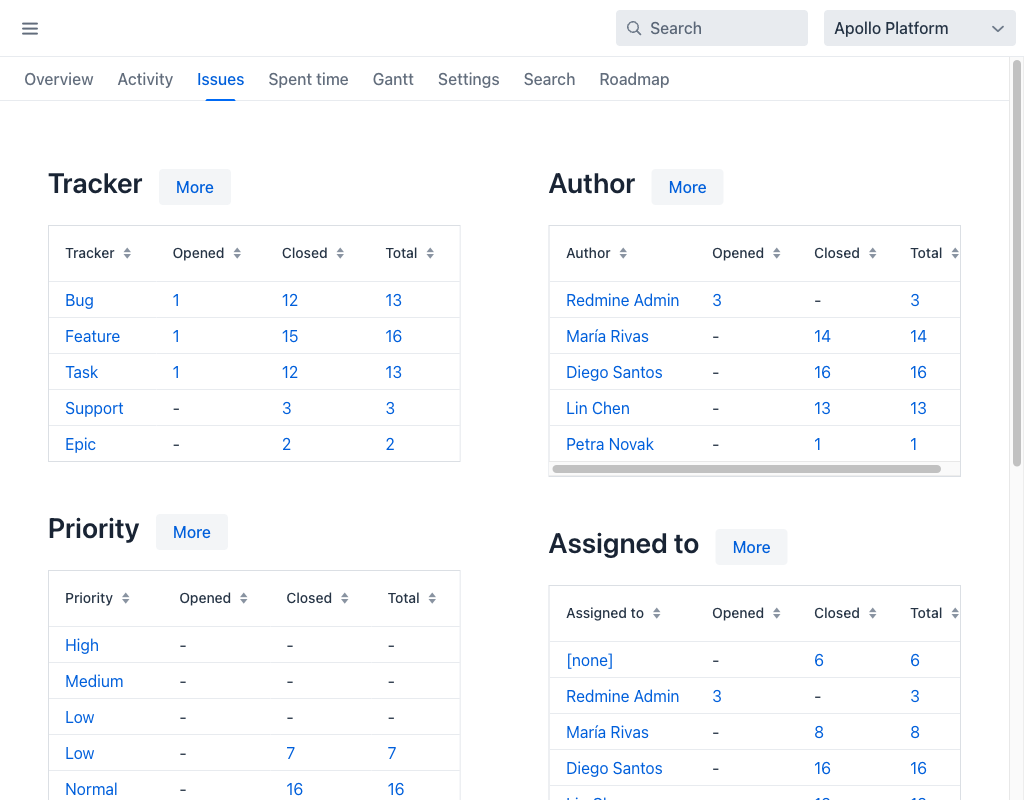
The Issues Report view provides a statistical summary of issues for a project, grouped by several dimensions. It is accessible from the Project Overview page via the report link in the issues summary area.
Summary Grids
The report is organised into two responsive columns of summary grids. Each grid shows the number of open, closed, and total issues for a given grouping dimension.
Left column:
- Tracker: Issue counts grouped by tracker type.
- Priority: Issue counts grouped by priority level.
- Issue category: Issue counts grouped by issue category.
Right column:
- Author: Issue counts grouped by the user who created the issue.
- Assigned to: Issue counts grouped by the user to whom the issue is assigned.
- Subproject: Issue counts grouped by subproject. This section is shown only when the project has subprojects.
Each grid displays three columns: Opened, Closed, and Total. A count of zero is shown as a dash (−) to make non-zero values easier to identify at a glance.
Detail Dialog
Click the More button in any summary grid to open a detail dialog for that dimension. The detail dialog adds a dedicated column for each configured issue status, showing the exact count per status alongside the summary totals.
A CSV export button is available in the detail dialog to download the full breakdown as a comma-separated file.
Spent Time
The Spent time view tracks time logged against issues within a project. It is accessible from the project navigation tabs and provides both a detailed list and a summary report of logged hours.
Details Tab
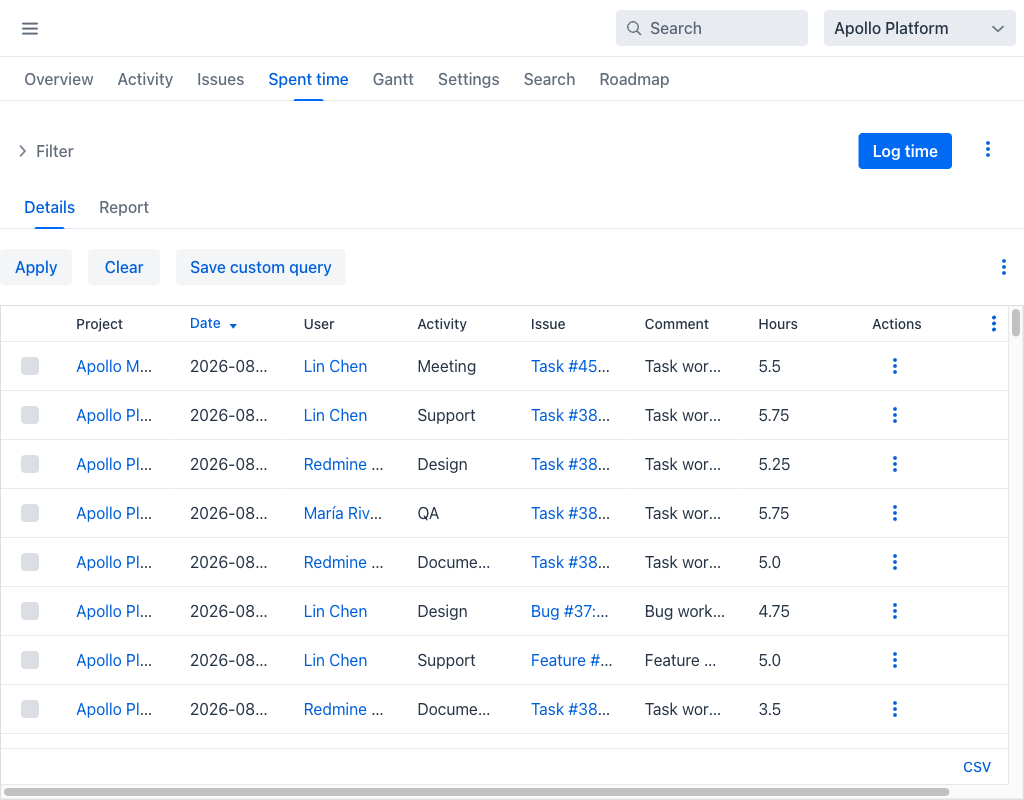
The Details tab displays individual time entries in a grid, with columns for Project, Date, User, Activity, Issue, Comment and Hours. Each row represents a single time log entry. The Log time button at the top records a new entry.
As in the issues list, the filters sit inside a collapsible Filter panel:
- Date: Filters time entries by date range (e.g., Today, Last 7 days, This month, or a custom range).
Additional filters can be added using the Add filter dropdown. Time entries can be filtered both by their own fields and by the standard fields and filterable custom fields of the issue they belong to, so a query such as "all time logged against Bug issues of a given target version" is expressible.
Report Tab
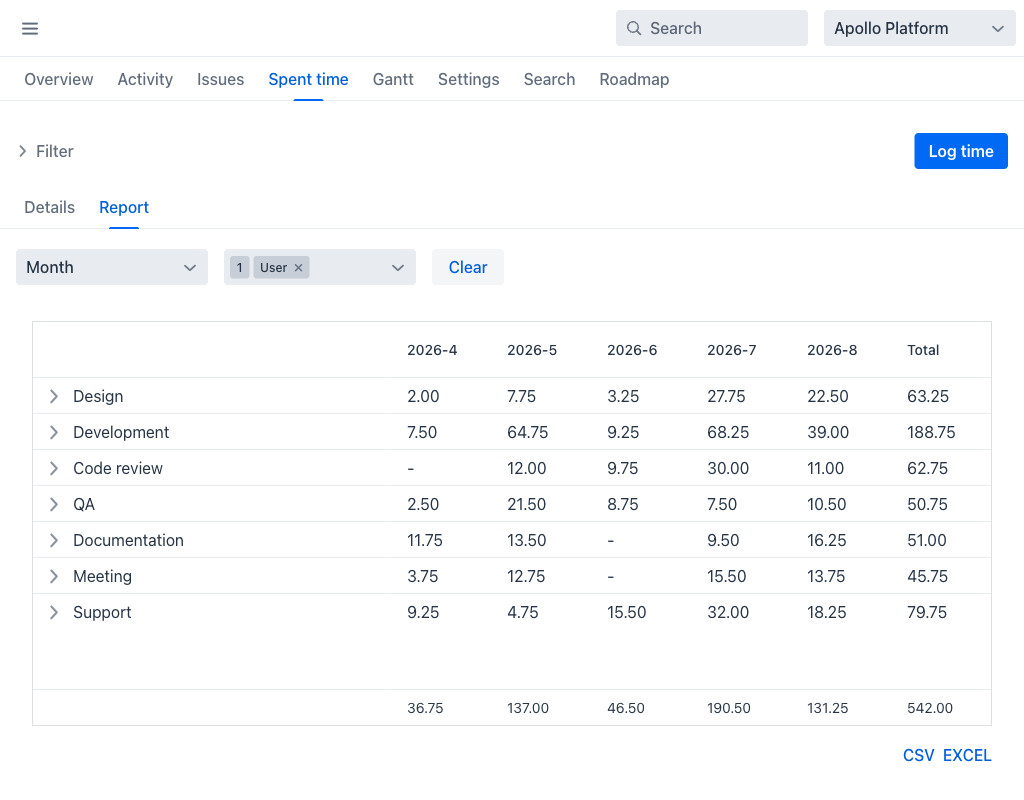
The Report tab provides an aggregated summary of time entries. The first dropdown chooses the period columns (e.g., Month), and the second selects one or more grouping criteria for the rows: Project, Issue, Tracker, Category, Status, Activity, User and Version. Selecting several criteria nests them, so each row can be expanded to reveal its breakdown.
Hours are shown to two decimal places, with a Total column and a totals row. A dash marks a period with no time logged, and time entries whose activity has since been removed are grouped under none.
Exporting Data
At the bottom of the Spent time view, CSV and EXCEL export buttons are available to download the time entry data for external use. The export follows the columns currently selected in the view.
My Page
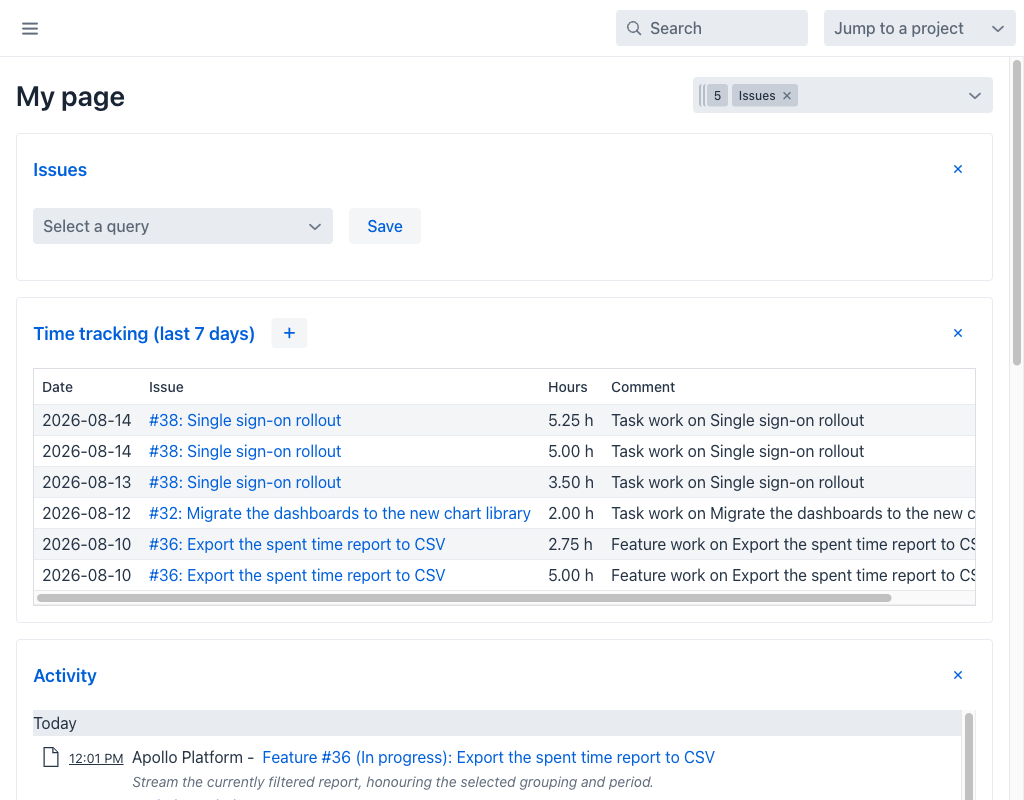
The My Page view provides a personalized dashboard for the current user. It displays widgets that aggregate information relevant to the user's work.
Blocks
The dashboard is assembled from blocks, chosen in the selector at the top-right of the view. Six blocks are available:
- Issues assigned to me: The open issues currently assigned to the user.
- Reported issues: The issues the user created.
- Issues watched: The issues the user is watching.
- Issues: Renders a saved custom query of the user's choosing. Pick one in the Select a query dropdown and press Save to keep it on the dashboard. Only queries the user may see are offered, and a query scoped to a project appears only if the user has access to that project.
- Activity: A chronological feed of recent activity across the projects the user can see. Each entry displays the timestamp, project name, issue reference, and the user who performed the action.
- Time tracking (last 7 days): The time logged by the user over the past seven days, with Date, Issue, Hours and Comment columns. Click the + button to log a new time entry directly from the dashboard.
The issue blocks are ordered by issue number, and the activity feed shows a bounded number of entries so that the dashboard stays readable. Each block can be removed by clicking its ✕ button, or by clearing it from the selector.
My Account
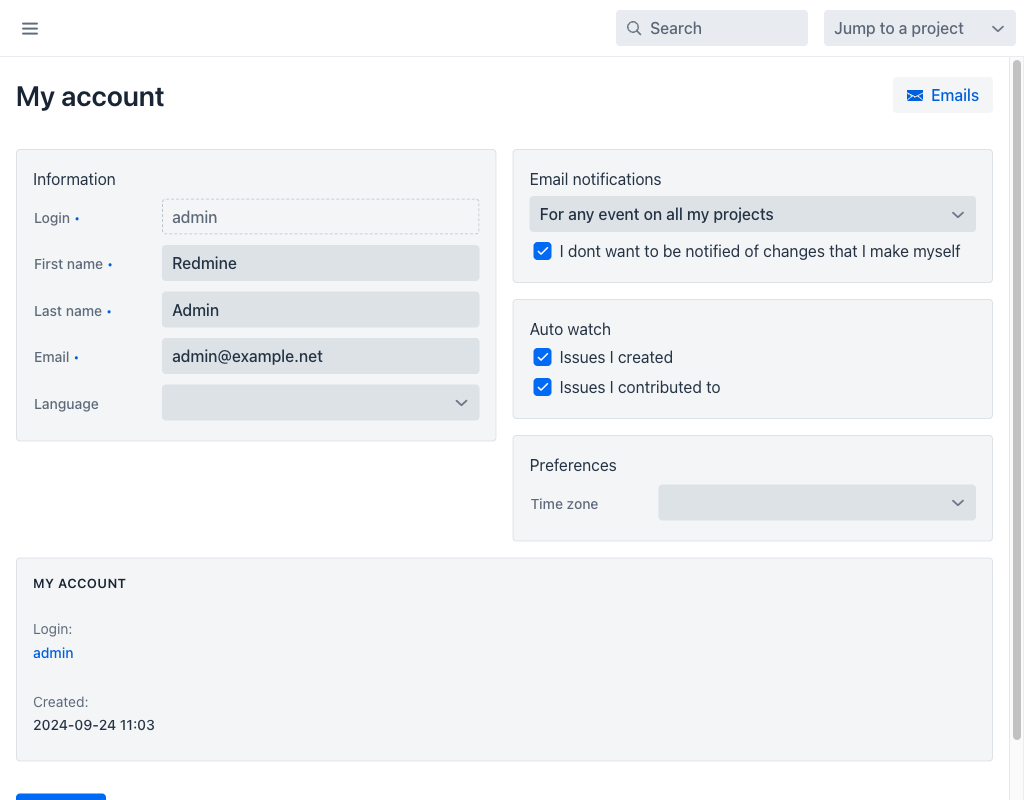
The My Account view allows users to manage their personal information and notification preferences.
Information
The left panel contains the user's personal details:
- Login (required): The username used to sign in.
- First name (required): The user's given name.
- Last name (required): The user's family name.
- Email (required): The user's email address for notifications.
- Language: The preferred interface language.
The Emails button in the header opens a dialog listing the addresses registered for the account, so that a user with more than one address can manage them.
Email Notifications
Controls when the user receives email notifications:
- Notification scope: Dropdown to select the notification level (e.g., "For any event on all my projects", "Only for things I watch or am involved in").
- I dont want to be notified of changes that I make myself: Prevents notifications triggered by the user's own actions.
Auto Watch
Configures automatic issue watching behavior:
- Issues I created: Automatically watches issues created by the user.
- Issues I contributed to: Automatically watches issues the user has commented on or updated.
Preferences
- Time zone: The user's preferred time zone for displaying dates and times.