Log Viewers
A Log Viewer is a page that displays a filtered and pre-configured view of the application's activity log. Administrators create these views specifically for end users, restricting the visible data to what is relevant for a given use case. Each Log Viewer is available at a dedicated URL within the application.
Navigating to a Log Viewer
Log Viewers are accessible directly via a URL path configured by the administrator. The link is typically provided through the application's navigation menu or shared directly.
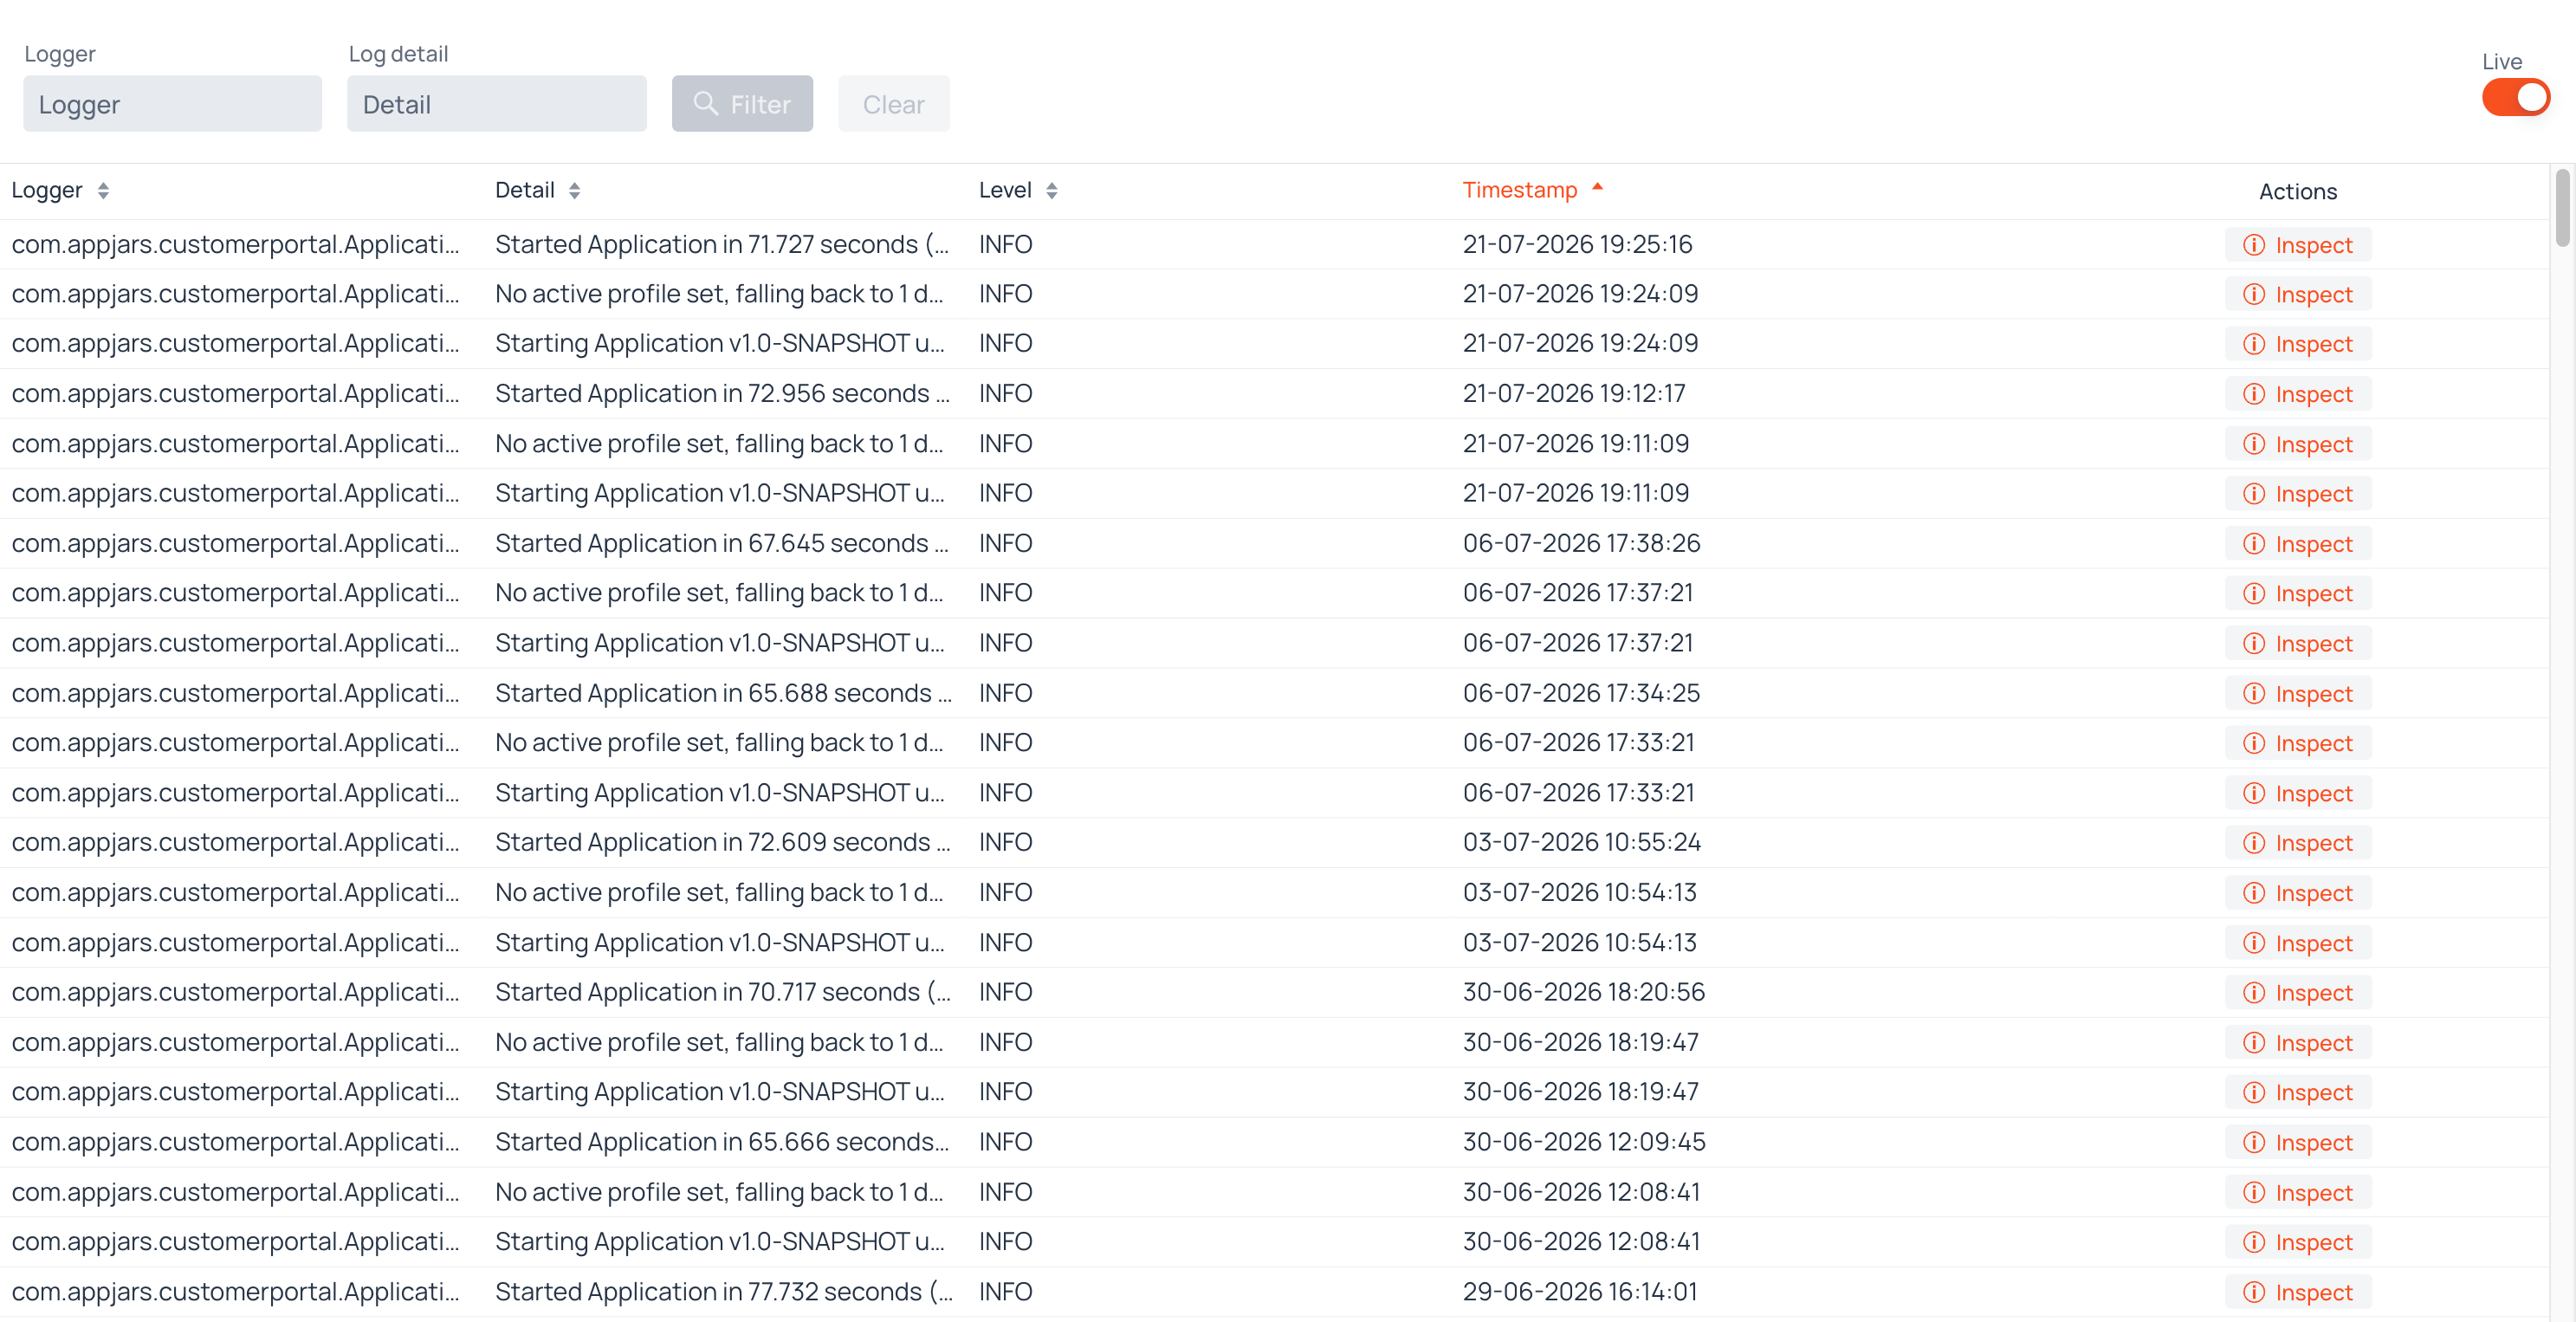
The Log Grid
The main content of a Log Viewer is a data grid displaying log entries. Each row represents a single log event captured by the system. The columns shown depend on the configuration set by the administrator. Possible columns are:
- Logger — The fully qualified class name of the component that generated the log entry.
- Detail — The message content of the log entry.
- Level — The severity level of the log entry (e.g., INFO, WARN, ERROR).
- Timestamp — The date and time when the log entry was recorded.
An Actions column is always present, and holds the Inspect button described below.
Columns can be sorted by clicking their header.
Note
Timestamps are shown in the time zone of the browser viewing the page, so dates and times always match the reader's local time.
Filtering
Depending on how the administrator has configured the Log Viewer, one or more filter fields may be available above the grid:
- Logger — Filters entries by the logger name.
- Log Detail — Filters entries by the content of the log message.
- Log Levels — Filters entries by severity level. Only the levels pre-configured for this viewer are available.
- Log start / Log end — Restricts entries to a specific date and time range. Selecting a date and time applies it to the filter immediately.
- Session ID — Filters entries by session identifier. The identifier is offered as a filter even though it is never shown as a column; open an entry with Inspect to read its value.
When a filter field is populated, the Filter button becomes active. Clicking it applies the filters and refreshes the grid. The Clear button resets all filter fields and restores the default view.
Note
Some filter fields may be read-only if the administrator has pre-configured a fixed value for that filter. In that case, the view always displays only logs matching that pre-set value.
Live Mode
If the administrator enabled live logs for the viewer, a Live toggle appears alongside the filters. When it is turned on, new log entries that match the current filters appear in the grid automatically, in real time, without reloading the page. Turning it off returns the grid to its normal behavior.
The toggle is not shown when live logs are not enabled for the viewer, when server push is unavailable, or when the application is running without a full license — live mode is a licensed feature. See Features That Require a License.
Inspecting a Log Entry
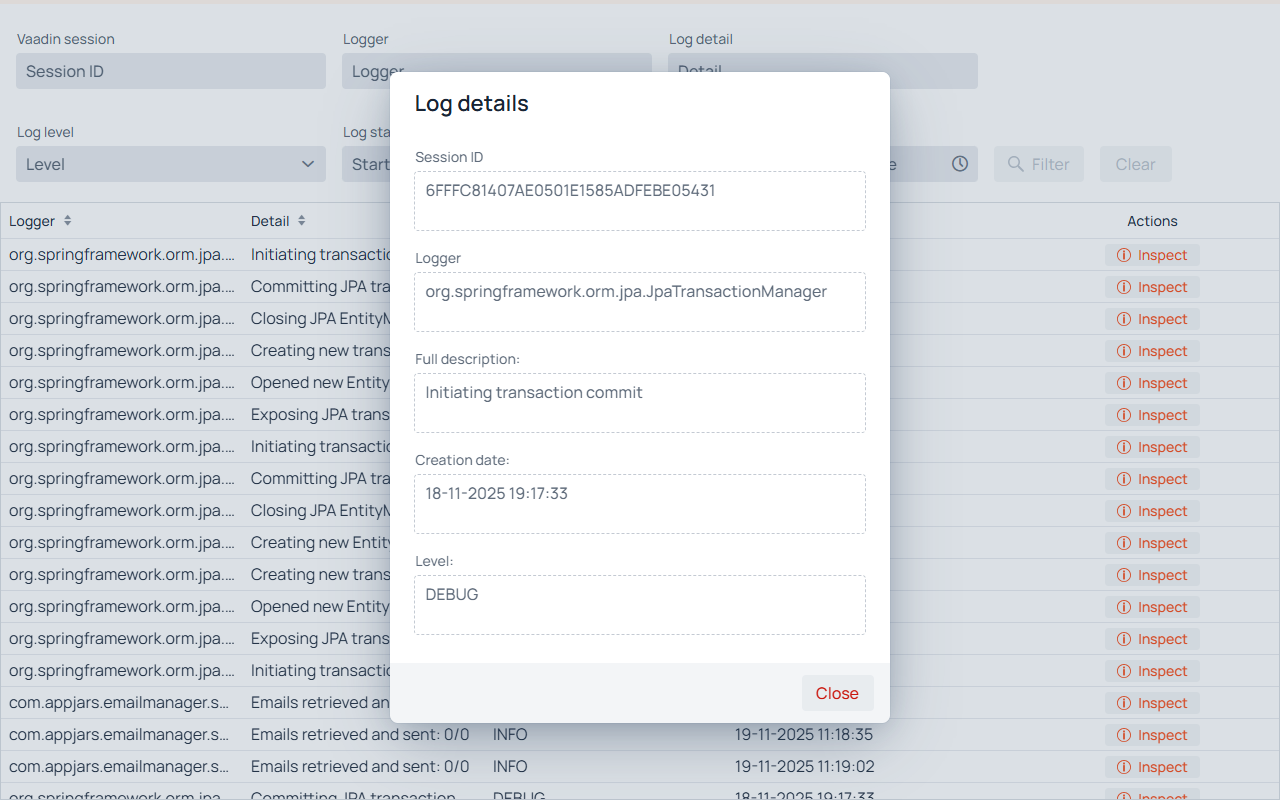
Each row in the log grid has an Inspect button in the Actions column. Clicking it opens a dialog with the full details of that log entry.
The header shows the Level, as a badge, and the Creation date of the entry. The body shows:
- Session ID — The identifier of the browser session the entry was captured during. All entries that share it belong to the same user session, which makes it useful for following the sequence of events in one session. The field is only present when the Extractor that captured the entry had the Save session ID option enabled. The value exists for correlation only and grants no access to the session it names.
- Logger — The fully qualified class name of the component that generated the log.
- Full description — The complete, untruncated log message.
If the entry carries a stack trace, a collapsible Stacktrace section appears below the fields, with a Copy button that places the full trace on the clipboard.
The dialog can also be opened by double-clicking any row in the grid. Click Close to dismiss it.