Users features
The features detailed in this section are the ones that can be accessed by any user in an application using this appjar. They cover the two screens a regular user works with: the report view of a single query, and a dashboard that shows several queries at once.
Both screens are built from a query definition that an administrator has already published, so what a user sees — which parameters are asked for, which columns appear, whether the result is a grid or a chart — is determined by that definition and not by anything the user configures.
Report View
The report view is the main screen for running a single query. It is reached from the Execute action of a query in the management view, from a link inside another report, or directly by its address.
The view is assembled in two parts. At the top, a parameter form asks for the values the query needs. Below it, once the query has run, the results appear as a grid, as a chart, or as a chart with its data grid beneath.
Parameter Form
The form shows one field per parameter the query declares, in the order the administrator arranged them. The type of each field follows the type of the parameter:
- Text parameters render as a text field.
- Whole number and decimal parameters render as numeric fields.
- Yes/no parameters render as a checkbox.
- Date and date and time parameters render as a date picker and a date and time picker.
- Predefined list parameters render as a dropdown holding the allowed values.
- A parameter that accepts several values at once renders as a multi-select dropdown.
Required parameters are marked with a dot next to their label and must be filled in before the query will run. A parameter may arrive pre-filled, either from a fixed default the administrator set or from a value that is worked out when the form opens — the current date, the name of the signed-in user, or a list of values taken from another query.
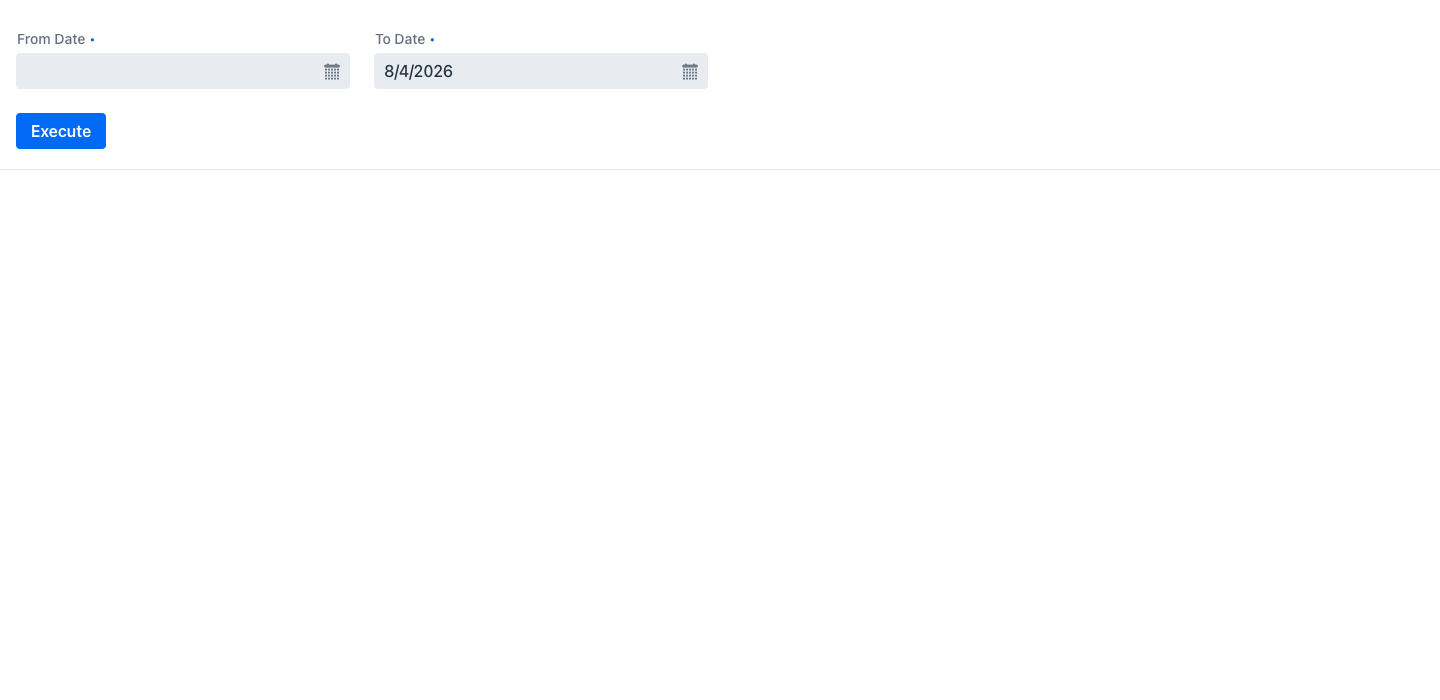
Clicking Execute runs the query and loads the results. Changing a value and clicking Execute again re-runs it.
When the report view is opened from a link in another report, the parameters carried by that link are already filled in and the results are shown straight away.
Results Grid
The grid shows one column per visible result column, with the label and the number, date or currency format the administrator configured.
- Sorting: columns marked as sortable show sort arrows in their header. Sorting is applied by the database rather than in the browser, so it orders the whole result and not only the rows currently on screen.
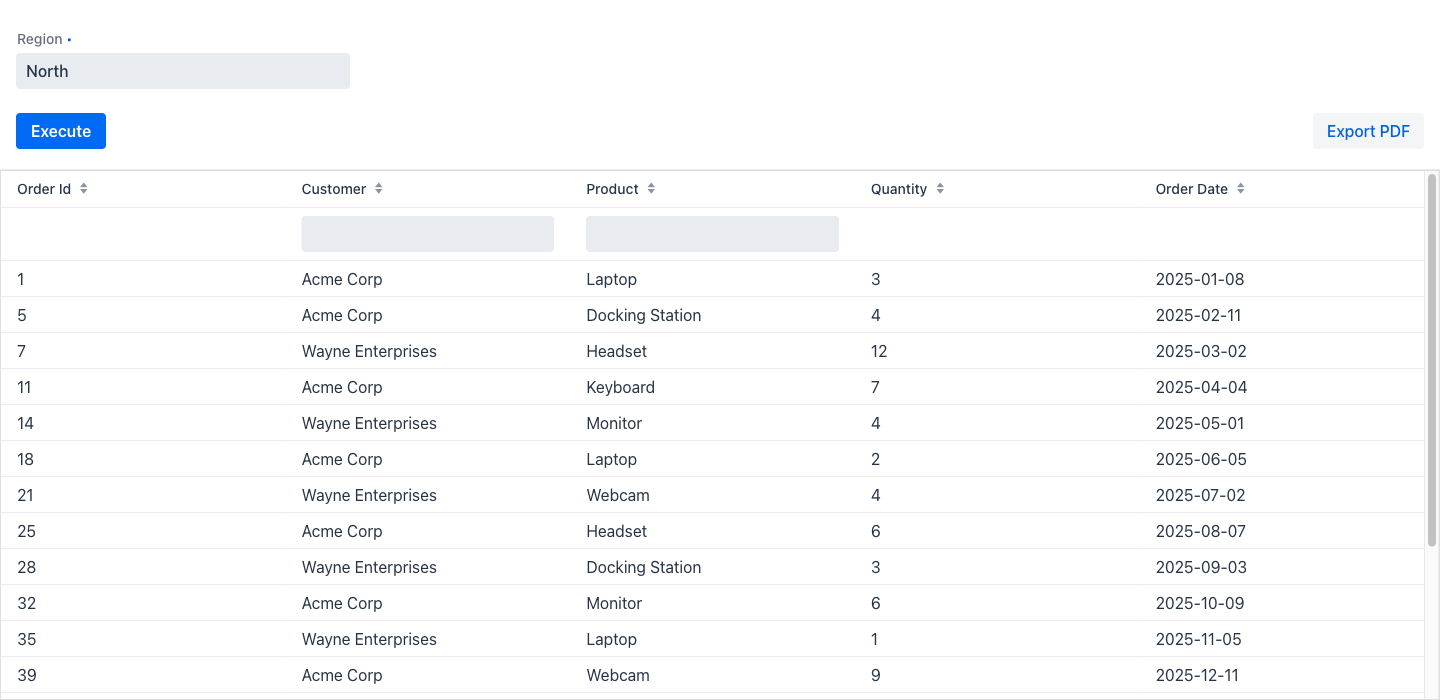
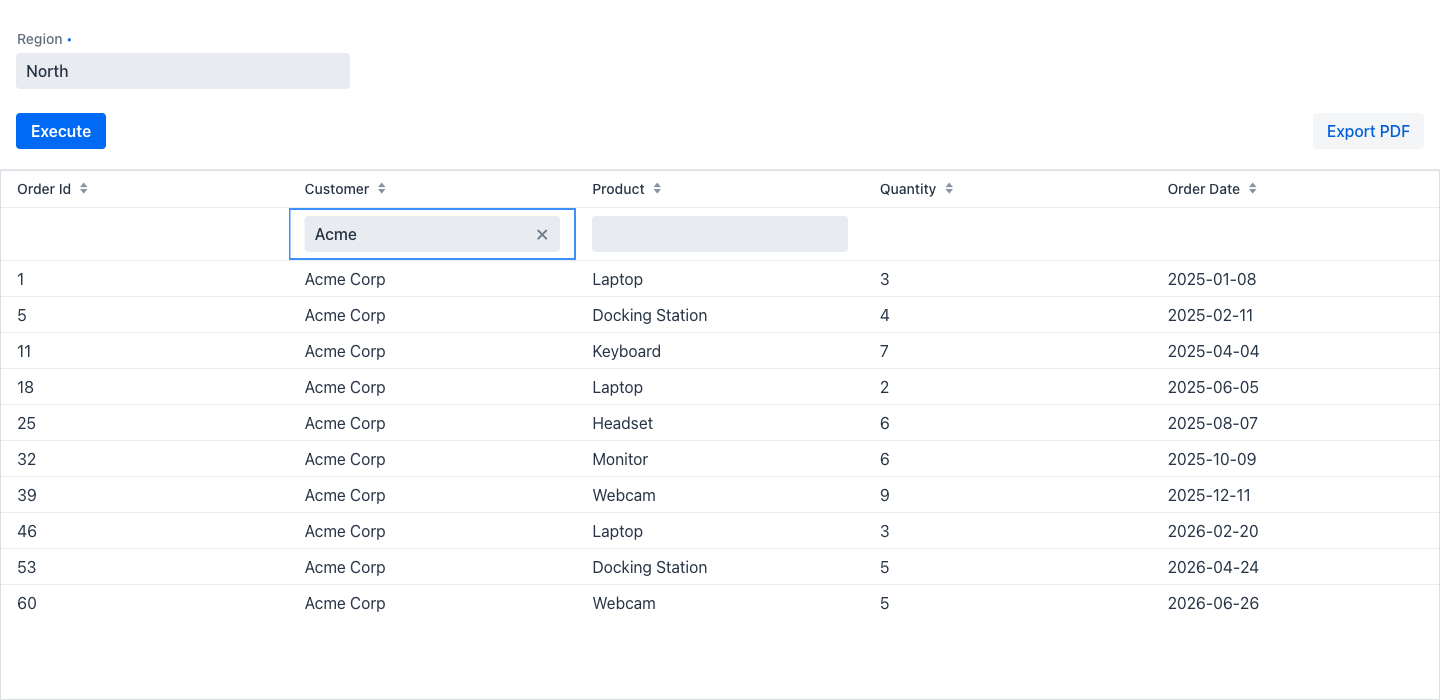
- Filtering: columns marked as filterable show a filter field in a second header row. Typing in one narrows the result immediately, and the filter is applied to the whole result as well.
- Scrolling: rows are fetched in pages as the grid is scrolled, so a report with a large result opens as quickly as a small one.
Following a Link
A result column may be configured as a link. Its values then appear as clickable text, and clicking one opens a target report with values from that row already applied as parameters — for example, clicking a region opens the orders of that region. The target may also be an address elsewhere in the application. A link may be configured to open in a new browser tab.
Exporting
The grid offers export buttons in its bottom right corner, producing the current result as a spreadsheet, a PDF or a comma-separated file. The export contains the whole result, not only the rows on screen, and preserves the column order, labels and formats of the grid. Any column filters in effect apply to the export as well.
When the administrator has attached a designed report layout to the query, the grid export buttons are replaced by a single Export PDF button in the top right corner of the view. It produces a laid-out document rather than a tabular dump — with a title, page headers and footers, and sections grouped by a column value — filled with the same rows, parameter values and filters that the grid is showing. The button becomes available after the query has been run at least once.
Charts
When the administrator has configured a chart for a query, the results are drawn as one instead of, or alongside, the grid. The available shapes are bar, horizontal bar, line, area, pie, donut and scatter charts. The chart carries the title and subtitle the administrator set, and its legend and colours follow that configuration.
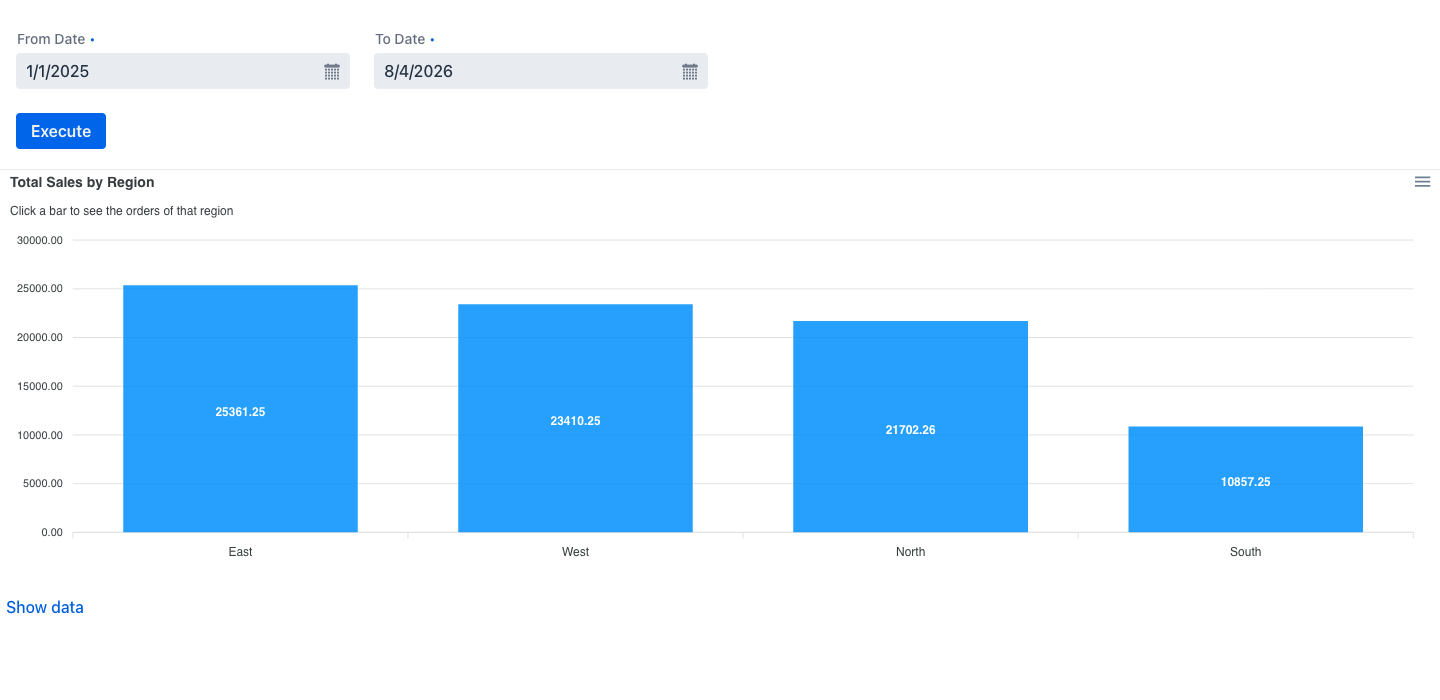
A Show data action below the chart reveals the grid of the same result, so the exact numbers behind a bar or a slice remain available, along with the export buttons. Hide data collapses it again.
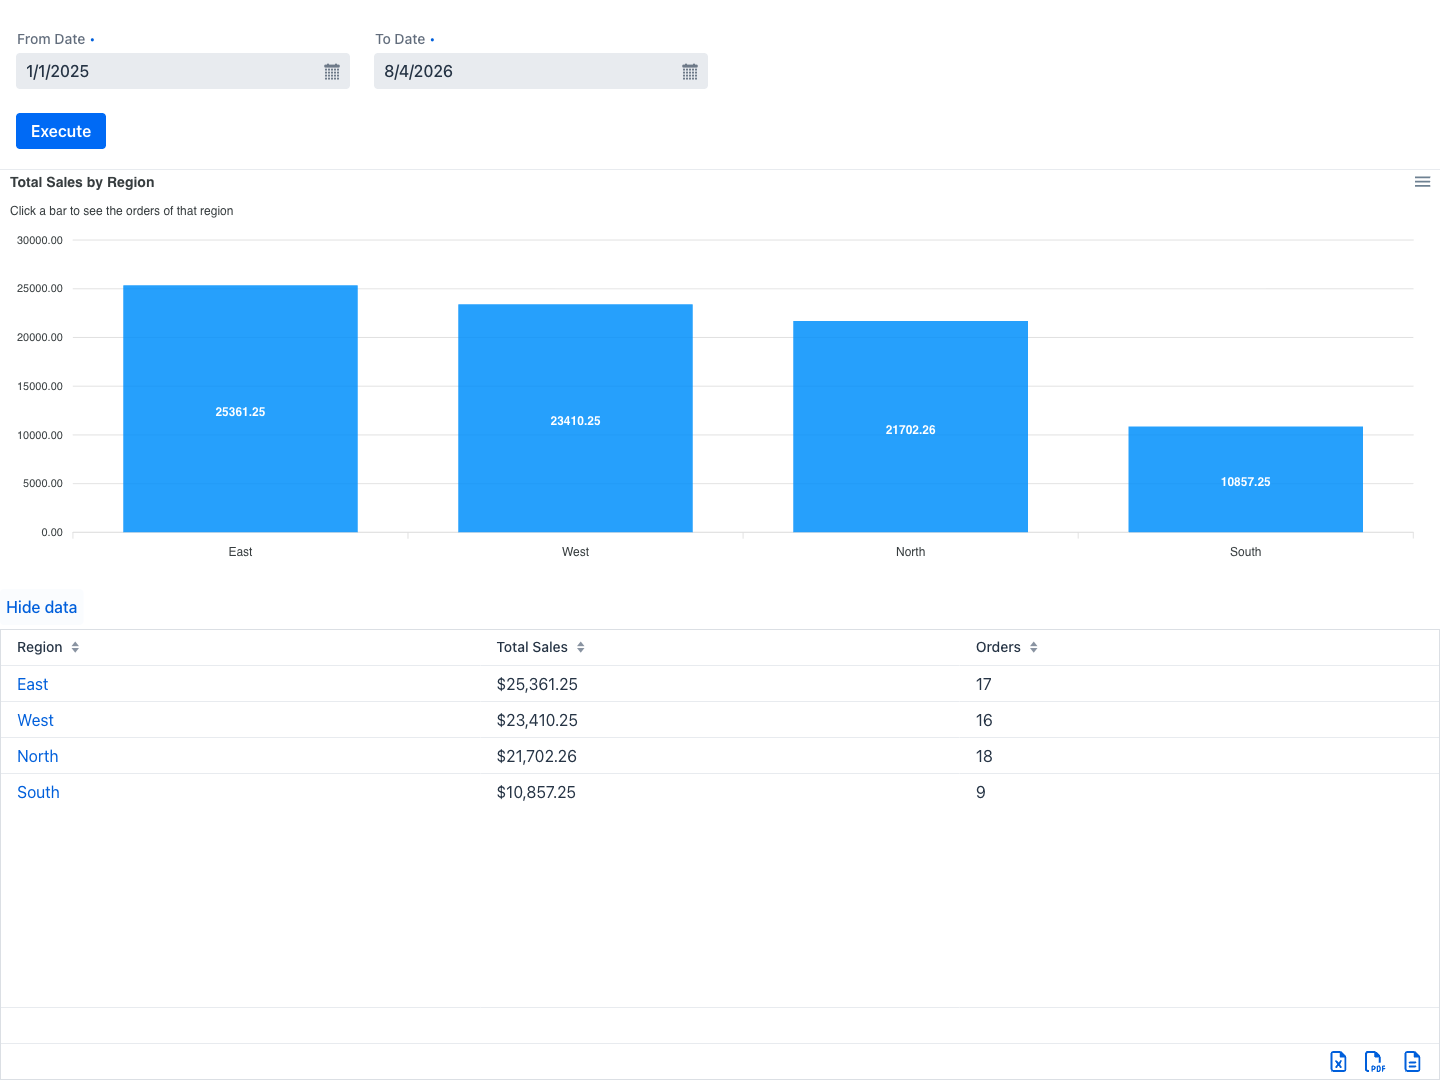
A chart may also be configured for drill-down. Clicking a bar, slice or point then opens a target report for that element, with the category, value or series behind it passed as parameters — the same behaviour as a link column, driven by the chart instead of a row.
Dashboards
A dashboard shows several queries on one page. Each panel, called a widget, renders one query as a grid or as a chart.
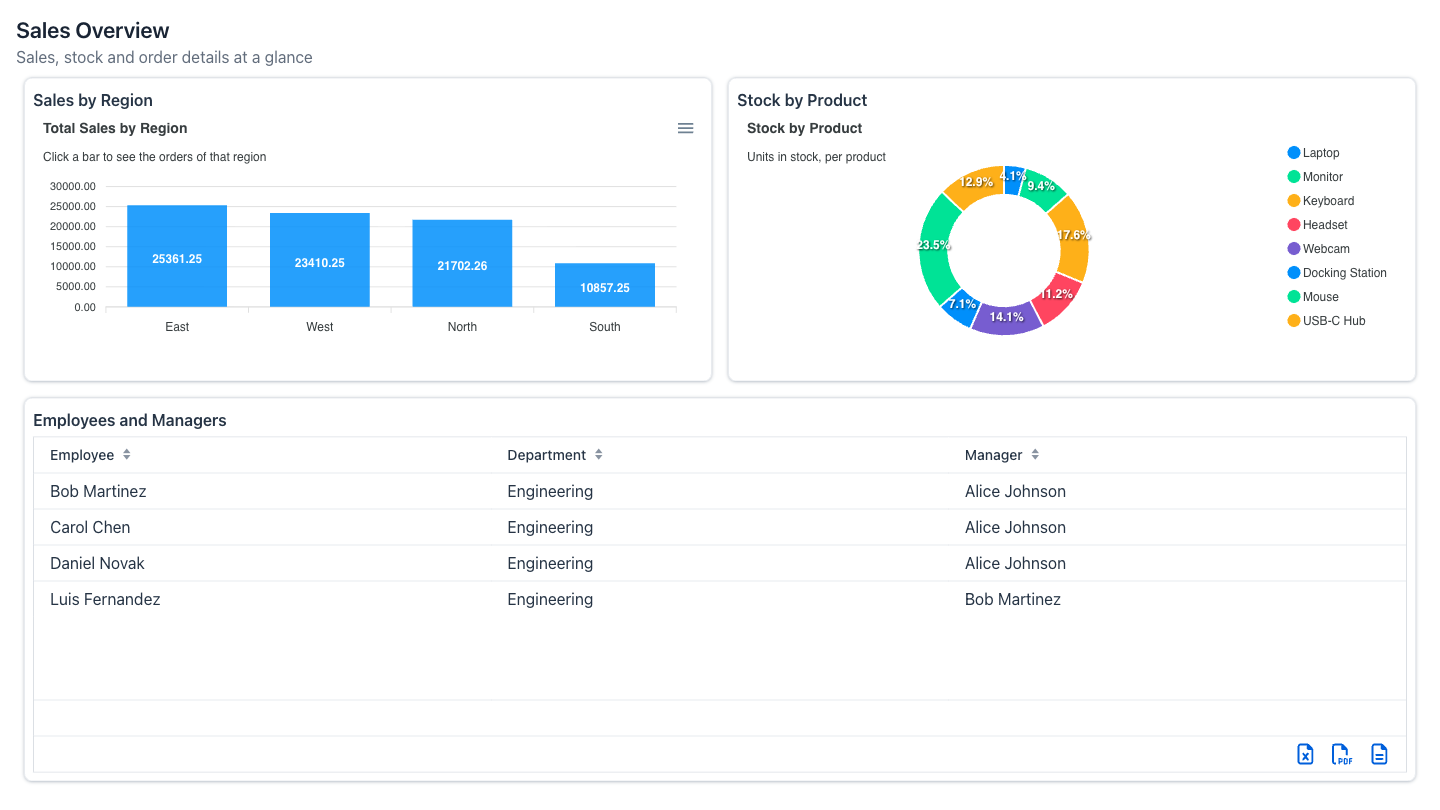
A dashboard has no parameter form. The values each widget's query needs were fixed by the administrator when the dashboard was composed, or are worked out at the moment the page opens — a widget showing figures up to the current date is refreshed simply by revisiting the page. A widget whose query still needs a value that was never supplied shows a notice in place of its data instead of failing.
Inside a widget the grids and charts behave as they do in a report view: columns can be sorted and filtered, the export buttons are available, and links and clickable chart elements navigate to their target report. A dashboard is therefore also an entry point — a starting overview from which a user follows a link into the detail.
Each dashboard has its own address, so it can be bookmarked or linked from the application's navigation. On narrower screens the widgets collapse from side-by-side columns towards a single column, keeping the order the administrator gave them.